These Data Management Trends Will Shape 2025.
Most companies wish they were doing more with data—but there’s more of a disconnect than ever between the best performers and the rest of the pack. Our recent survey of CROs shows that most companies are still building their data fluency. Only 25 percent of leaders have high confidence in their data, and only 18 percent believe their sales systems provide a single source of truth. Meanwhile, new AI and data tools are opening new ways for the most tech-savvy companies to get more value from their data.
Whether your company is aiming to make up ground or build on a position of strength, several important trends will shape how you use data in 2025. By understanding what’s happening in the market, you can know more about your own strategic landscape and gain a competitive advantage. Let’s explore the data management trends shaping the market today.
1. The Modern Data Stack is Here to Stay.
As access to accurate, comprehensive data has become a key concern for businesses large and small, there’s been a growing consensus among data professionals on a best practices design for the modern data stack. The need for AI readiness has accelerated adoption, and more and more companies have built a system with the same basic features.
Let’s compare a modern data stack to a traditional data setup. While they share the major features—data ingestion, transformation, warehousing, and business intelligence—a modern data stack also features three major differences:
- All-in-one approach. In a modern data stack, users have far greater freedom to build within their system, increasing their speed to deliver working products two to three times faster. You can easily store, process, run AI & build apps for your data in the same environment, avoiding complicated data architectures and integrations that slow down your speed to ship & iterate.
- Extensibility and compatibility. With the modern data stack, your data products are future proof. No more data migrations every five years to upgrade and access the newest innovations. Many modern data platforms offer a range of compatible apps and add-ons, giving you access to additional functionality around data transformation, lineage, cataloging, observability and more. With data shares and iceberg tables, many companies have removed costly integrations because they can access the data from their partners through instant sharing. No more waiting for data to “refresh” and spending hours reconciling between systems.
- Custom apps and marketplaces. This means that it’s rare to start from scratch to build what you need and no more costly integrations. There are free datasets—everything from market intelligence to economic conditions to weather patterns—and pre-built apps that can be used to stand up what you need in minutes versus weeks.
While building a modern data stack can seem like a big undertaking, if you have a proper roadmap with phasing, it’s simpler than you’d expect—especially with the abundance of pre-built migration tools available. Ask yourself: What’s the highest priority to the business? Do you want to automate responses to support cases from your customers? If so, what data sources will you need? What format does the data need to be in to be used? Who will be using it, and how? From there, you can build a system that responds to your needs, opening your data to strategic use.
2. Data is Going Decentralized.
But just because the modern data stack is increasingly key to data management doesn’t mean everything is centralized. The conventional wisdom in recent years has been that companies need a single central repository for all their data. While there are many reasons to make data broadly available and consistent throughout the enterprise, that doesn’t mean it all should be stored in a single place. Many business technology vendors have introduced integrated data management capabilities that allow you to manage all your information for sales, finance, operations, and more through the tools you already use.
Decentralizing your data with tools like this has a few major benefits, but the primary one is speed. With decentralized data, instead of your finance team having to work with IT to get data structured the way they need it, they can have their data available directly. This removes a bottleneck to insights, allowing end users to find and use data quickly.
To get the full benefit of this new paradigm, a few things will need to shift. Instead of relying on dedicated data teams, everyone who manages a given system will need to become a data person in one way or another through the “hub & spoke” model. Since data isn’t separate from the part of the business it relates to, the team that manages it shouldn’t be either. With this transition, you’ll need to think about how data stewardship can continue to happen. Every new data manager will need incentives to keep data quality high and avenues to report data issues. A well-designed system can maintain data governance even when data is spread out across your organization.
Decentralizing data will also require an updated data strategy. Even if data is going to be distributed across your organization, you’ll still need a single source of truth, and that means understanding how each data source interacts.
3. Analytics Are for Everyone.
How often do you need to ping your data team for clarification on what’s included in a metric or when the data was last updated in a dashboard? Or even worse—why two data points that should be the same don’t match across two team’s reports? At best, systems that keep analytics hidden take up unnecessary staff time. At worst, they mean your analytics won’t get used at all. As businesses see this pattern, they’ve responded by not only adopting self-service, but also self-documenting analytics.
Self-service analytics are just what they sound like. Instead of analytics being handled by a single central data team, everyone who works with data at your company has report building and analysis capabilities. Your data team can spend less time on report building, and everyone else will have more powerful reporting capabilities.
The more elite companies, meanwhile, have also adopted self-documenting analytics. These companies set up a common “semantic layer” that defines metrics and explains the logic to anyone who wants to see how and when the numbers they’re looking at were calculated. Instead of a separate step to create this documentation, tools like dbt automatically create lineage and documentation out-of-the-box.
These tools can also make data more explainable. When the data team handles all business transformations and report building in a silo, end users often don’t understand how a metric or report comes into being. On the other hand, self-service & self-documenting analytics means users get to unpack their reports, see how they work, and customize them to their needs. The key benefit to this process is a greater level of trust in data from end users.
4. Your Data Warehouse is Becoming a Key Operational Platform.
Business operations have generally kept their analytics and tooling separate. You see a variance in your report, but to close the gap you go to a separate application to make corrections. While these are good enough for some purposes, modern enterprises recognize how much time is wasted by having the numbers separate from where the action takes place. As a result, leading businesses are beginning to run many of their operations directly from custom apps that embed analytics from their data warehouse into their workflows. Modern cloud platforms now have the power to drive operational workloads, connecting curated, up-to-date data sets with apps, AI-powered chatbots, reverse ETL, and more.
Getting started can be easier than you might think. Snowflake, for example allows anyone to build data applications directly on top of their data using Streamlit. Many leading companies build custom apps to manage risk. The demo below is one example: manufacturers can use predictive solutions to proactively identify potential issues and submit work orders from the same application. Instead of using a patchwork of systems to predict and then report a problem, users can work from their analytics interface.
5. Manually Working with Data Puts You at a Disadvantage.
Up until recently, the biggest challenge in data completion and quality was simply getting your team members to input their data—invariably using a manual system, or from other records. But today, with new AI-powered data extraction tools, organizations shouldn’t be relying on manual entry or updates to manage data. In fact, organizations still manually updating data are at a disadvantage compared to their competitors. A better data governance strategy that uses AI to streamline things will help you compete.
The logic here is simple: The more you use data, the more existential of a threat bad data is going to be. While manual data entry is a simple process, even the most careful people make typos and other mistakes that can build up in your system. Even worse, some users may actively game the system by entering progress far beyond what is completed. Meanwhile, as AI gets cheaper and better, the companies adopting it for their data entry are getting a bigger and bigger advantage from automation that helps them get accurate data more quickly.
LLMs can predict, from a handful of data points, important information about your clients and ensure it’s updated in your data warehouse. However, the most efficient companies aren’t simply “dumping” unstructured data into an LLM to get a result. Instead, they are being strategic about where to use third-party services or services within your data platform that have pre-compiled information to be deterministic (like billing addresses) and where to use AI to help fill in the blanks using natural language. Further, efficient data teams are providing an interface to QA and save LLM results to save money on reprocessing data that has already been accepted.
Users who follow the latest data management trends aren’t just using AI to fill in the blanks. They’re creating agents that can execute processes like scanning emails and automatically creating contacts so your sales team doesn’t need to add them manually. With a few use cases, you can drastically cut down on human error and free up your people for face-to-face interaction.
6. Explainable AI is Changing the Game
Making predictions was one of the first data management trends that actually made AI useful for businesses, and many companies already use predictive AI to generate first draft forecasts for sales, expenses, market trends, and more. These predictions are generally reliable (and getting more so every day) but alone, most predictive AI tools don’t explain their answers. Many enterprises that have tried predictive AI in the past have found it to be a “black box” with limited explanatory potential. These enterprises may be surprised to see how far AI has come—especially when combining predictive systems with large language models (LLMs) to provide more complete answers.
This kind of combined approach gives you the benefits of deep learning algorithms along with the conversational interface of an LLM. Your LLM can read the data in your system and provide reasons for why the numbers are the way they are, both building trust and ensuring ease of use for analysts who aren’t AI experts.
Consider how a traditional AI model might handle an optimization problem—for example, how to pack a truck full of materials the most efficiently. As outlined below, you’d have your inputs for the equation, the constraints you need to navigate, and the answers you’re looking for.
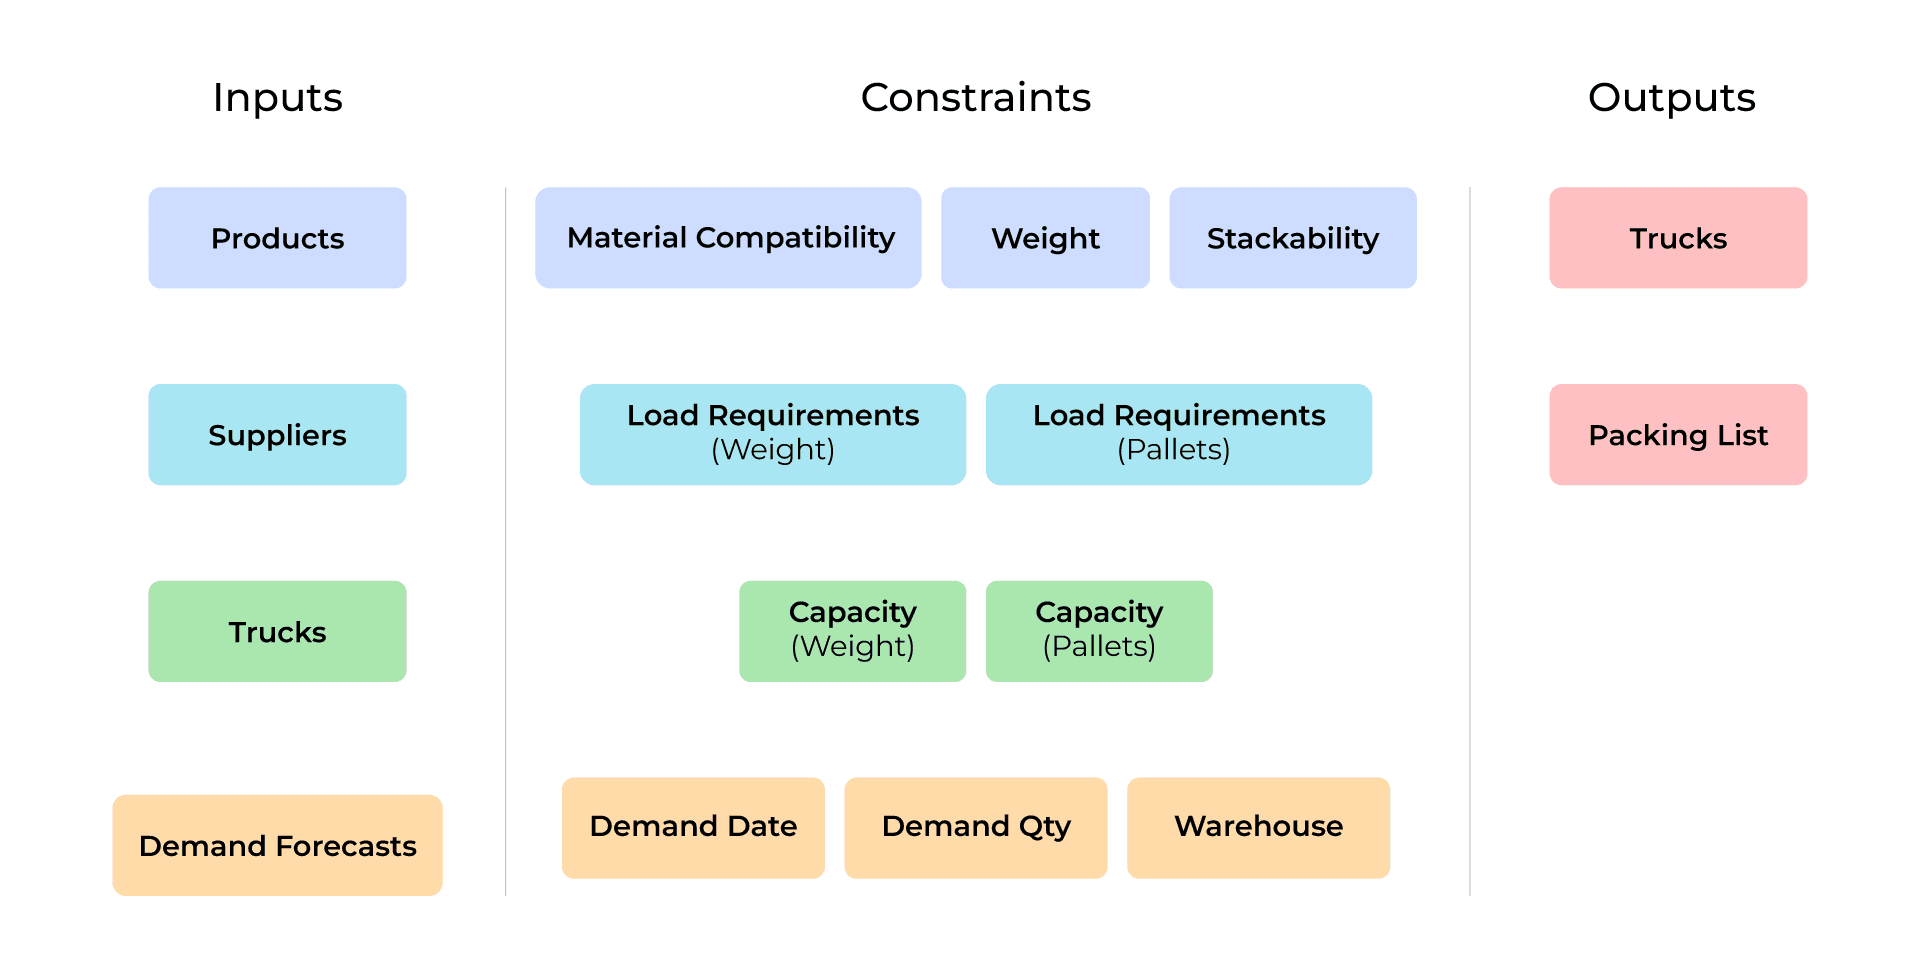
An AI model that just provides the answer is one thing—but how do you justify that packing list? Explainable AI can provide a logic summary that shares what specific assumptions shaped its reasoning. As seen below, an LLM can summarize the logic it used to get to a specific answer.
Code (Input to LLM)Current Logic Summary (LLM-Generated)
# Read in datasets into dataframes
df_product = snowpark_df_to_pandas_df(product)
df_demand = snowpark_df_to_pandas_df(demand)
df_supplier_constraints = snowpark_df_to_pandas_df(supplier_constraints)……..continued
- Total Weight Constraint: The total weight of items in each truck cannot exceed the maximum weight capacity of the truck (20,000 lbs).
2. Total Pallet Constraint: The total number of pallets in each truck cannot exceed the maximum pallet capacity of the truck (26 pallets).
3. Total Product Weight Constraint: The total weight of a product across all trucks cannot exceed the product’s total demand weight.
4. (Commented Out) Product Bin Constraint: Ensures each product can be in at most one truck.
5. (Not Working) Supplier Constraint: Ensures each truck contains products only from one supplier.
6. (Not Implemented) Min/Max Supplier Constraints: Placeholder for additional constraints related to supplier-specific limits.
As circumstances change, the LLM will continue to explain how it achieved these numbers. In this example, several new constraints have been implemented—and your system provides a full explanation of what’s changed since the last time the optimization process was run and why.
Code (Input to LLM)Current Logic Summary (LLM-Generated)Delta Summary (LLM-Generated)
# Read in datasets into dataframes
df_product = snowpark_df_to_pandas_df(product)
df_demand = snowpark_df_to_pandas_df(demand)
df_supplier_constraints = snowpark_df_to_pandas_df(supplier_constraints)……..continued
- Single Bin Constraint: Each item can be in at most one bin.
2. Maximum Weight Constraint: The amount packed in each bin cannot exceed its max weight.
3. Maximum Volume Constraint: The amount packed in each bin cannot exceed its max volume.
4. Stackability Constraint: Number of pallets must be under the max. Stackable pallets count as half a pallet in this calculation.
5. Single Supplier Constraint: Ensure that all products in a bin have the same Supplier ID.
6. Single Warehouse Constraint: Ensure that all products in a bin have the same Warehouse ID.
7. Product Compatibility Constraint: Ensure that products must be compatible.
8. Perishable Product Constraint: Perishables must ship no more than 1 day before the demand date.
New
1. Stackability Constraint: Number of pallets must be under the max. Stackable pallets count as half a pallet in this calculation.
2. Single Warehouse Constraint: Ensure that all products in a bin have the same Warehouse ID.
3. Product Compatibility Constraint: Ensure that products must be compatible.
4. Perishable Product Constraint: Perishables must ship no more than 1 day before the demand date.
Removed
1. Total Product Weight Constraint: The total weight of a product across all trucks cannot exceed the product’s total demand weight.
2. (Commented Out) Product Bin Constraint: Each product can be in at most one bin.
Changed
1. Single Supplier Constraint: Changed from a commented-out constraint to an active one, ensuring each truck contains products from only one supplier.
2. Maximum Weight Constraint: Changed to include supplier considerations, ensuring weight constraints are applied per supplier in each truck.
3. Maximum Volume Constraint: Changed to include supplier considerations, ensuring volume constraints are applied per supplier in each truck.
7. LLMs Need Retrieval-Augmented Generation.
Everyone who’s used an LLM has experienced an AI model confidently spitting out a hallucination. Because of the data LLMs are trained on, even advanced models can provide dodgy responses. Businesses need better accuracy than that—so to solve this problem, many have turned to retrieval-augmented generation (RAG). In RAG, your large language model is integrated with your existing data, allowing you to ground the answers in your entire data stack—not just the pre-baked data your LLM has access to. And because many data tools now support LLM capabilities on platform vs requiring a separate integration, you can be sure your data is safe.
Properly set up, not only does RAG can give you the ability to query your data in natural language with high trust that the results will be rooted in reality—it also allows you to be innovative in the way you support customers to drive higher conversion and faster times to resolution.
Here’s an example. Say a customer messages a support chatbot. While a non-RAG chatbot might propose a nonsensical solution, using RAG will give the chatbot the ability to provide thoughtful, context-sensitive answers. If the customer has already checked the company’s FAQ page, or previously contacted support, the chatbot can avoid proposing solutions that haven’t worked. And because the chatbot can access all corporate rules for talking with customers, it’s much more likely to provide the right answers.
AI-powered sales agents are another big use case for retrieval-augmented generation. An agent can know your company’s sales playbook better than any sales representative, using the details of every offering, every client story, and every pitch to advise you on deals. But beyond that, it has access to every data point on the client as well. As a result, agents can personalize every part of sales outreach down to the right title for an email.
Keeping Up with Data Management Trends Can Deliver Competitive Advantage.
Data management trends are always hard to predict. 2025 will likely see unexpected new technologies and tactics emerge to tackle challenges that are only now coming into focus. But with effective use of data, AI, and other tools, your organization can be better prepared to make the right decisions.
A better data stack and the tools it enables will provide a major competitive advantage to any company able to use them. We’ve helped numerous organizations across the country take the next step with their data, open new capabilities with the help of AI, and understand their strategic landscape more. If you’re curious about how to do this yourself, contact us.