Private Equity Firms Need Insights to Compete
2024 represents a critical opportunity for private equity firms. After years of pandemic-induced economic turmoil, the economy seems strong and interest rates may finally be going down. But PE companies looking to grow have questions to answer first: What does healthy growth look like? What’s the best way to drive it for each of my portfolio companies? What acquisitions make sense? In this three-part series of articles, we’ll look at how your data infrastructure is an underrated tool for answering the most important questions. We’ll study three different needs for growth, starting with portfolio management, making sure your company has the right systems in place for efficient profitability.
Good Portfolio Management Is Critical for Private Equity
Private equity firms have dozens, if not hundreds, of portfolio companies—and each one has its own unique data ecosystem for sales, financials, and HR processes. When private equity companies need to compare performance, the job becomes difficult quickly. There are two main challenges:
First, aligning metric definitions across portfolio companies is difficult. Aggregated KPIs such as total capitalization, revenue, EBITDA, and organic vs inorganic growth metrics are difficult to compare when relying on systems with different definitions in each portfolio company.
Second, onboarding and maintaining portfolio company data is a full-time job for several people. As we’ll explore in more detail later in this series, bringing new acquisitions on board is a difficult job (though it doesn’t have to be). As a result, it could be weeks or even months before your company has access to comprehensive performance data from a new acquisition.
When companies don’t understand their own data transformation process and don’t trust their data, analysts and the C-Suite alike are left scratching their heads. Basic capabilities such as reporting, and comparisons become difficult—and more advanced capabilities like ML/AI become next to impossible.
With Jerome Powell hinting at the prospect of several rate cuts in 2024 and a warming market, firms need to begin to position themselves to take advantage—and getting the basics locked down is the first step. A cloud-driven portfolio management solution can unlock insights into comparative PortCo performance and maximize fund performance, reducing the time from data onboarding to actionable insights.
A Better Data Pipeline Simplifies Portfolio Management
Despite your best efforts to standardize, every PortCo is a bit different. That means, at every stage of growth, many PortCos will maintain unique blends of data sources that fit their needs. At the portfolio level, the resulting tangle of data silos is difficult to bring together, manage, document, and asses—but modern data tools mean seamlessly connecting siloed data is not the monumental task it once was.
Though PE firms have historically had to manage data extraction, transformation, and loading (ETL) manually, they can also use their data warehouses and private data share tools to avoid that process altogether, instead sharing live, governed, and secure data across regions, clouds, and accounts without the need for data movement or replication.
These capabilities aren’t just about saving time for the firm. Portfolio companies can also use systems like this to access the firm’s proprietary data without needing direct visibility into each other’s data, maintaining data isolation between them. The data remains live and up to date, eliminating the need for manual updates (which often mean spreadsheets emailed back and forth).
This repeatable data pipeline serves as the foundation for data engineers and scientists to connect related records like accounts, contacts, and opportunities. Depending on the specific data challenge, PE firms may choose to use listing, data exchange, and/or direct shares—all have their uses.
Of course, not all PE firms are totally secretive with PortCo data. Often, two or more PortCos will work together more closely, and they may have more complex data usage needs as a result. If that sounds like you, your firm could explore adaptative data sharing options to give PortCos more granular access controls. The ability to define specific access rights and permissions for each data consumer can keep data secure while still making it useful across regions and across clouds. The important thing is to consolidate the data silos first, so all the information can get where it needs to go for collaboration and exchange.
The results are clear: adopting smarter data sharing practices provides a faster, cleaner, and more secure way to share data compared to traditional manual processes. The time, effort, and resources required for data preparation and sharing, as well as those used to maintain data isolation and security between portfolio companies, can then be spent on much more valuable activities. Activities like data analysis. Speaking of which…
Transform and Analyze Your Portfolio Data
Getting the data points you need where you need them is a good start—but it’s still just the start. After data is shared, getting it in a comparable and usable format gives your analysts the foundation they need to pull valuable insights out of it. PE firms should adopt data transformation tools that enable analysts and engineers to transform data using simple to maintain, modular SQL commands and create a semantic layer, which will ultimately give you the functionality for reporting, AI/ML, and other downstream systems.
A semantic layer also enables firms to have a single source of truth across all portfolio companies, independent of the underlying data systems each company uses. Your data transformation tool should be self-documenting—that is, it should allow business users to clearly see what data sources and fields are used to calculate each metric. This kind of transparency reduces back-and-forth questions about the lineage and freshness of data that often slows down analysis.
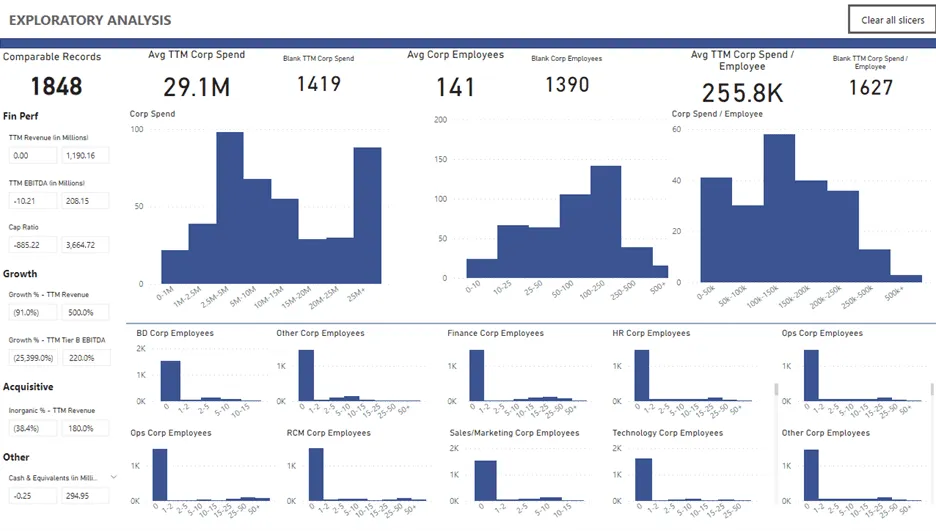
Transformed data is then ready for analysis. With the semantic layer in place, your firm can create custom visualizations, dashboards, and reports to give you full visibility into portfolio company performance. Sales, finance, HR, and operations data can be contextualized with indicators to quickly see areas of improvement, and analysts can look across funds & companies and drill down to line-item expenses. The dashboard below is one example of what the result can look like. This is a real dashboard Spaulding Ridge built for a PE client (though populated with dummy data for privacy reasons).
Data for Profitability Goes Beyond Portfolio Management
The dashboard above is an example of one way of pulling value out of the system—by seeing at a glance how employees are distributed across your PortCos—but once you have the data transformed and ready for analysis, you’ll have countless ways to use it to enhance your portfolio operations.
For Shore Capital, that meant the ability to access data from sales systems, finance systems, and HR platforms all through a central data warehouse, with reporting in PowerBI, realized through Snowflake. With the dashboards at their disposal, Shore realized a 3X ROI with Spaulding Ridge in cost-savings vs implementation cost. Shore now spends most of their time analyzing their data versus bringing together the data, in large part due to the wide adoption of these dashboards across the firm.
If you’re navigating disconnected data systems, or if you’re tracking PortCo performance via spreadsheets, Spaulding Ridge can help—our Data Solutions team uses Snowflake to build information management systems that give teams the insights they need to innovate. Our private equity data accelerator helps companies consolidate data and drive actionable insights, giving you best practices data warehousing design and security quickly, giving you a data pipeline, semantic layer, and reporting dashboards within weeks. Keep your eyes out for our next article in this series next week. And meanwhile, if you’re curious about how we can help, let’s talk!